在R作图系统中自定义坐标轴
R作图系统中坐标中的标签默认是等间隔,下列尝试是为了将少量数据的坐标显示在坐标轴上。
加载库并定义数据
library(lattice)
library(ggplot2)
library(grid)
library(gridExtra)

x <- c(1, 2, 3, 7, 8, 9)
y <- c(1, 23, 12, 77, 14, 2)
data <- data.frame(x = x, y = y)
data
##   x  y
## 1 1  1
## 2 2 23
## 3 3 12
## 4 7 77
## 5 8 14
## 6 9  2
Base作图系统
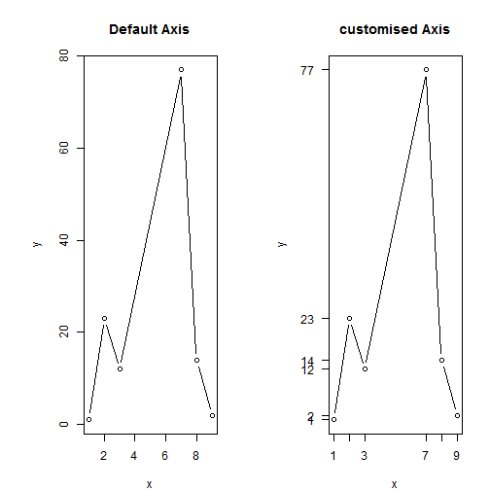
opar <- par(mfrow = c(1, 2), mar = c(4, 6, 4, 2))
with(data, plot(x, y, type = "b", main = "Default Axis"))

par(las = 1)
with(data, plot(x, y, type = "b", main = "customised Axis", xaxt = "n", yaxt = "n"))
axis(1, data$x)
axis(2, data$y)

par(opar)
Lattice作图系统
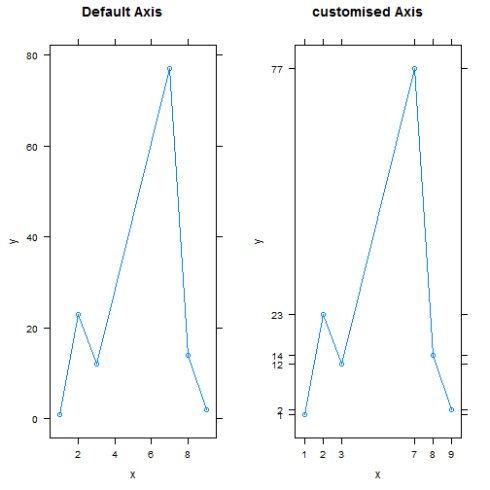
plot1 <- xyplot(y ~ x, data, type = "b", main = "Default Axis")
plot2 <- xyplot(y ~ x, data, type = "b", main = "customised Axis", scales = list(x = list(at = unlist(data$x)),
    y = list(at = unlist(data$y))), las = 1)
grid.arrange(plot1, plot2, ncol = 2)

ggplot2作图系统
vplayout <- function(x, y) viewport(layout.pos.row = x, layout.pos.col = y)
grid.newpage()
pushViewport(viewport(layout = grid.layout(1, 2)))

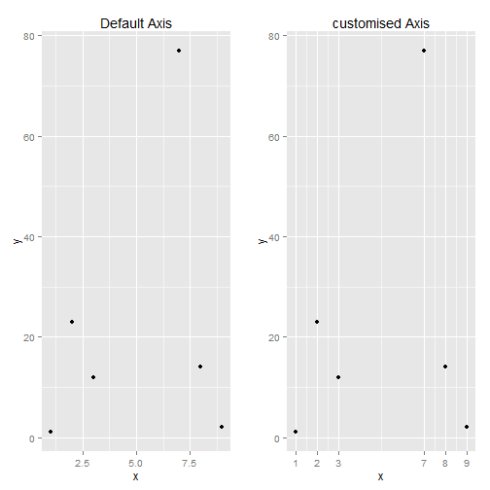
g1 <- ggplot(data, aes(x, y)) + geom_point() + labs(title = "Default Axis")

g2 <- ggplot(data, aes(x, y)) + geom_point() + labs(title = "customised Axis") +
    scale_x_continuous(breaks = x)

print(g1, vp = vplayout(1, 1))
print(g2, vp = vplayout(1, 2))

引用
Controlling Axes of R Plots
Getting rid of axis values in R Plot
rotate ylab
Custom lattice axis scales
lattice坐标系和坐标轴
ggplot2: customised X-axis ticks
Combined plot of ggplot2
Quick-R Graph